ADC Analytics: System and Network Dashboard and Reports
Starting with this version, the Alteon System and Network dashboard and Reporting are available using APSolute Vision 4.20 or later. These screens are a centralized set of dashboards that graphically display the health and performance of your system, enabling you to proactively plan capacity, and to troubleshoot and detect anomalies. The Reporting capability lets you define, generate, schedule, and send reports, either manually or automatically in PDF, HTML, or CSV format. The dashboards and reports provide real-time as well as historical data (up to three months).
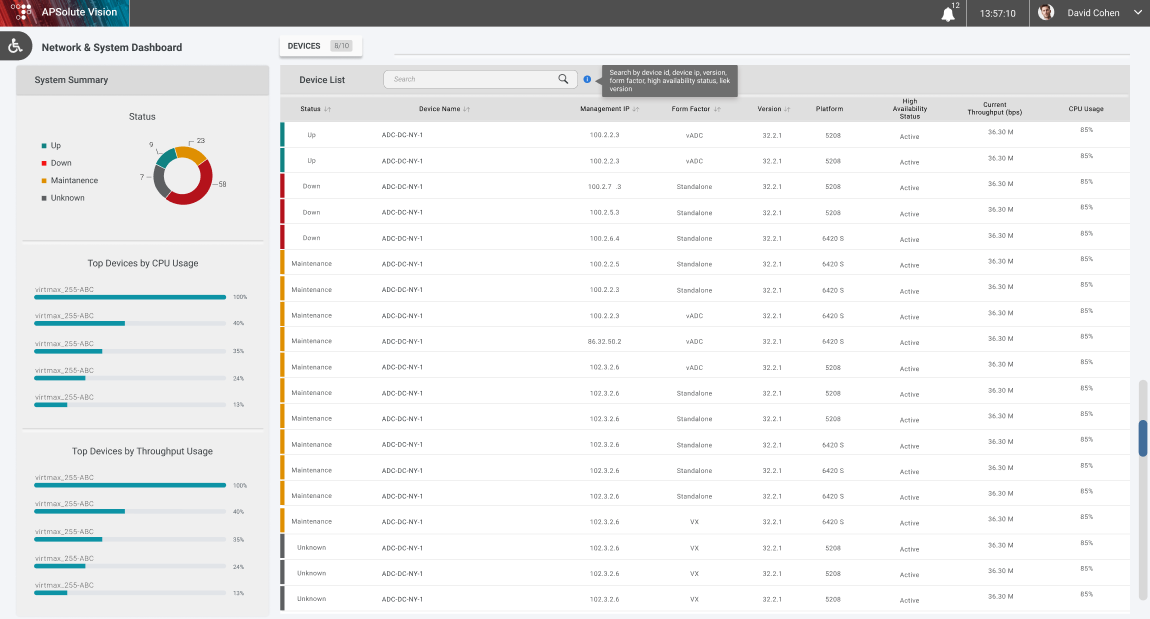
System and Network Dashboard Main Screen
The System and Network Dashboard main screen displays a summary of all the Alteon devices (32.2.1.0 and later) managed by APSolute Vision. From here you can identify at a glance the top devices by throughput or CPU in addition to other key information per device.
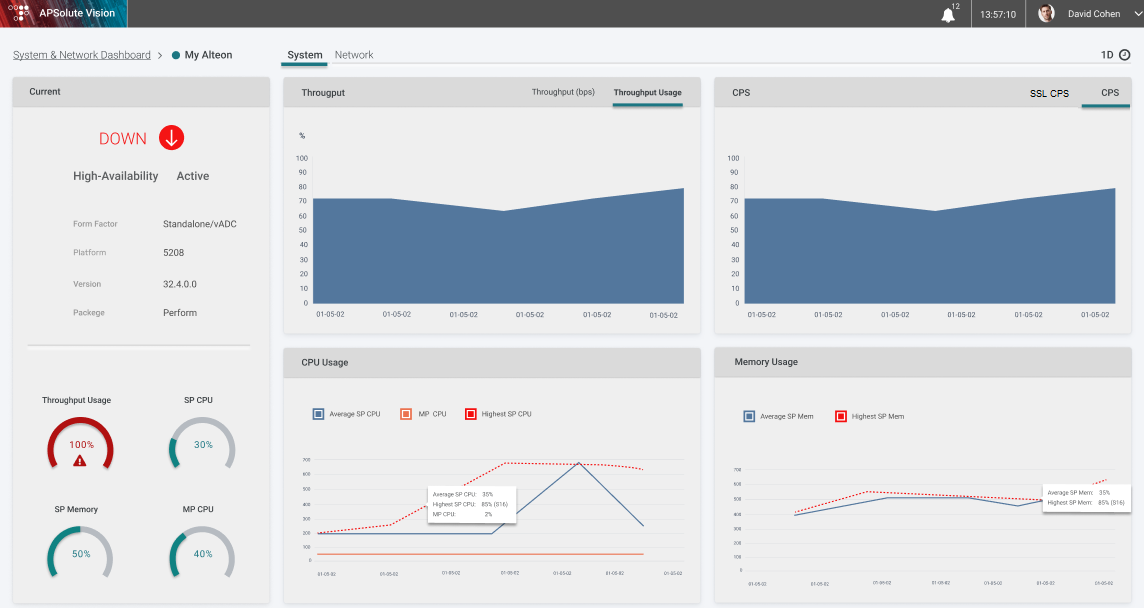
System Dashboard Screen
Clicking on an individual device opens a more detailed view of the system, such as MP/SP CPU, throughput utilization, SSL CPS, and its groups and servers, helping you troubleshoot any health and performance issues, and more.
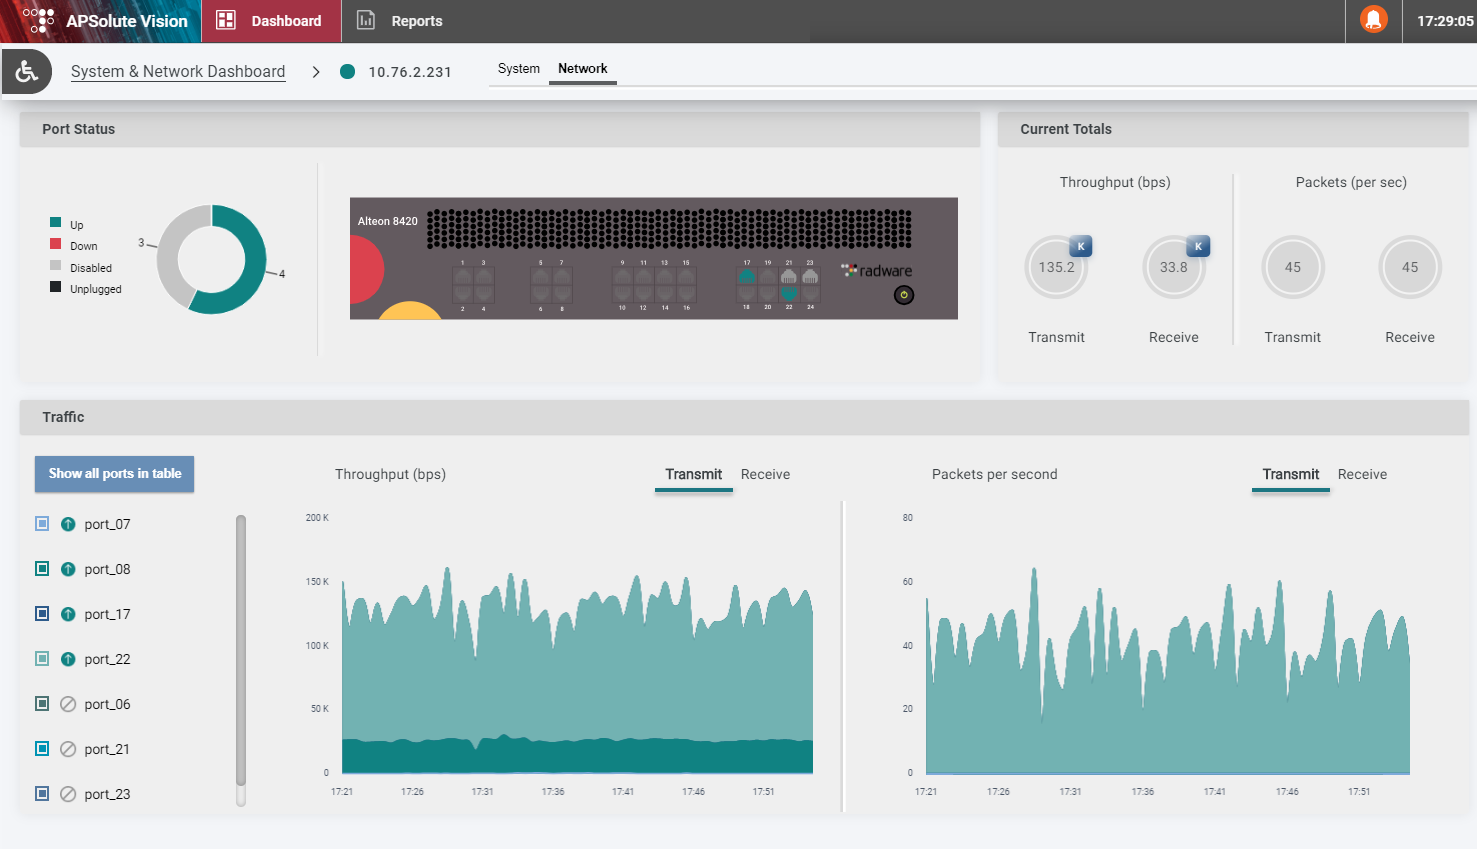
Network Dashboard Screen
Clicking on the Network tab displays a screen with the device ports’ statuses and TX and RX statistics: